The Total Solar Eclipse of April 8, 2024
In the weeks leading up to the total solar eclipse of April 8, 2024, I found myself curious about how astronomers can predict eclipses and accurately calculate where and when they will be visible. To learn about the topic I decided I wanted to build an application to explore the event. I had a few goals in mind for this project:
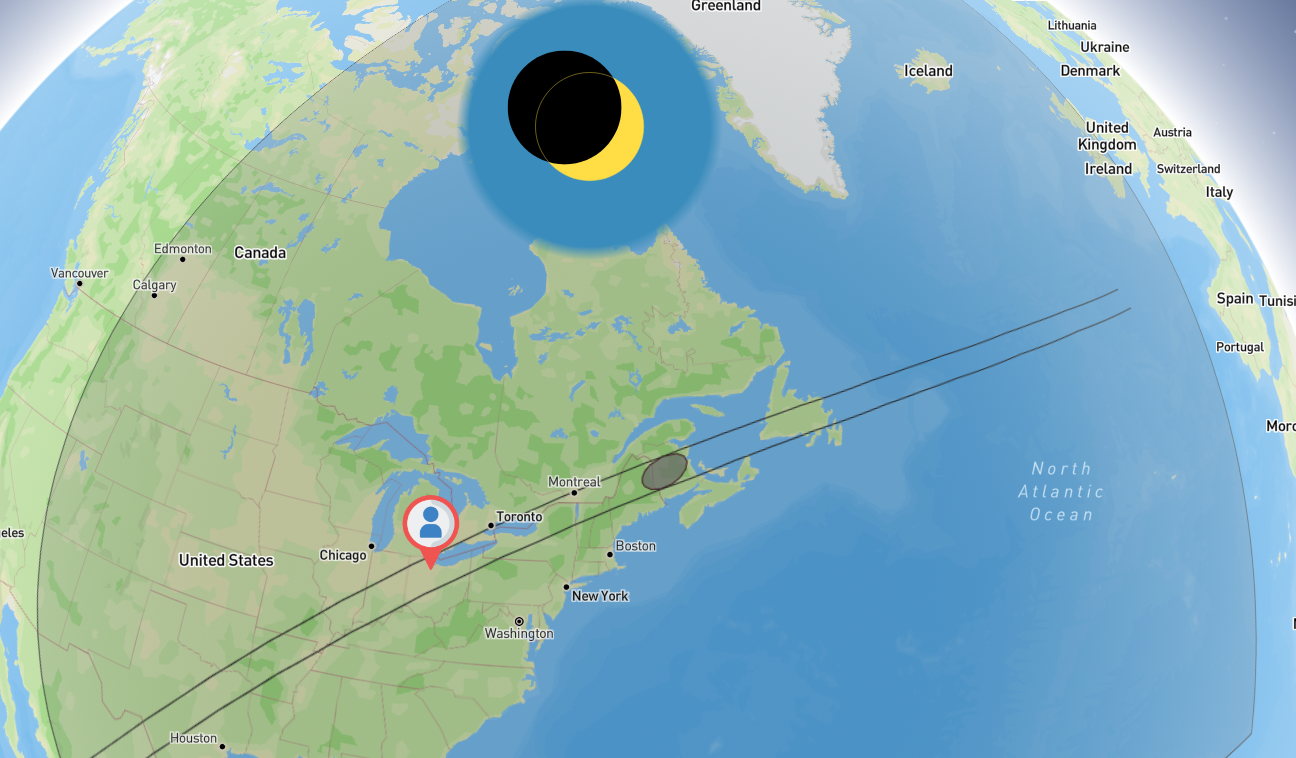
- calculate and view the path of totality
- calculate and view the outline of the shadow cast by the moon onto the earth’s surface
- animate the shadow outline over time, and allow the user to pause and scrub forward/backward
- view the local circumstances of the eclipse for a given location, such as the apparent proporation of the sun that is covered by the moon, and when the eclipse starts and ends
- if possible, make the experience simple and accessible to non-astronomers
Initially I had guessed that I would be able to find precomputed paths and time-stamped shadow outline polygons provided by astronomical oganizations, such as NASA. Although I did come across some sporadic articles that published tables of the path of totality, it was very rare to find data for shadow outlines. Slowly I realised I would have to compute these myself, meaning I would have to build an understanding of the mathematics behind solar eclipses.
Before We Dive In…
If you’re more curious about the end-result and less so about the the history/mathematics, click below to check out the resulting application yourself.
Click here to try the application yourself
The app is primarily built on the following libraries: Mapbox-gl for rendering the globe and path/shadow outline shapes, React for managing time playback state and UI widgets, dynamic svg for the sun/moon overlay graphic, and vanilla Javascript to run the calculations.
From here on down, I’ll be discussing the math and a bit of history that I learned about solar eclipse prediction. Come with me as I scratch the surface of these topics and apply them in rendering an interactive visualizatino of the “path of totality” of a total solar eclipse.
Ephermis and Predicting Eclipses
How do we know when an eclipse is going to happen? A very simple answer is that astronomers observe the relative movements of the sun, earth, and moon, and check for times in the future (or past) where the three bodies “line-up” (also known as conjunction). In other words, if you draw a line straight through the center of the sun and the center of the earth, you would then check if that line intersects (or comes very close to) the moon. Describing it this way is fairly straight-forward, but as you might expect, the reality of computing when and how these celestial bodies align is a bit more complicated.
Astronomers, dating as far back as the Babylonians, are able to observe and record the trajectories of celestial bodies at intervals over time. This includes measurements of relative position, velocity, acceleration due to gravity, etc.. Given enough of these observations it is then possible to accurately predict where these celestial bodies will be at a future time. These records of past observation and future (or past) predicted values are then collected into a table known as an ephemeris, or plural ephemerides. In the past these would all be calculated by hand and written or printed into books; of course today these are typically calculated and made available via computers.
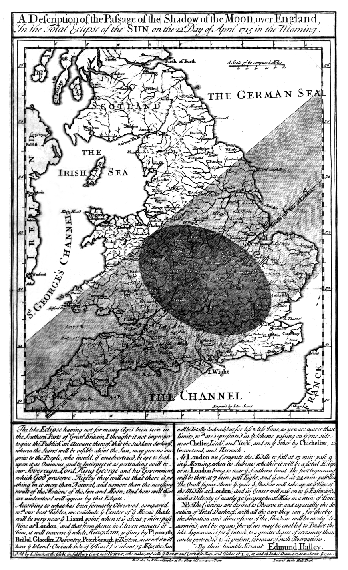
Given these ephemerides that include the sun, earth and moon, it is then possible to accurately calculate where each body will be at a given time over a long time period. This gives us the information we would need to step through time at some reasonable interval, calculate where each body will be at each time step, and check for a conjunction, where each body is nearly in line with each other. Doing this methodically by hand in the age before computers sounds absolutely daunting to me, but was surprisingly common, and proved very accurate. For example, Edmond Halley made use of ephemeris data to predict the total solar eclipse over Great Britain on May 3, 1715, to within 4 minutes and 20 miles accuracy. He was even able to produce a map showing the shadow’s path and shape.
Computation and Besselian Elements
As you might imagine, the process of calculating where the shadow of a total solar eclipse will fall would be extremely tedious when calculated by hand. In an attempt to simplify the calculation of where an eclipse would be visible to an observer on earth, the German scientist Friedrich Bessel developed a method to determine a set of polynomials that describe the local circumstances over the short duration of time that the eclipse takes place. Rather than dealing with the orbital trajectories of celestial bodies, these polynomials reduce the problem to a set of values describing the movement of the eclipse shadow in terms of the earth’s center and radius.
The values defined by the Besselian elements are as follows (as described on Fred Espenak’s eclipswise.com):
- x, y - Cartesian coordinates of the lunar shadow axis in the fundamental plane (in units of Earth’s equatorial radius)
- L1, L2 - Radii of the Moon’s penumbral and umbral/antumbral shadows in the fundamental plane (in units of Earth’s equatorial radius)
- d - Declination of the Moon’s shadow axis on the celestial sphere
- µ - Hour angle of the Moon’s shadow axis on the celestial sphere
- f1, f2 - Angles of the penumbral and umbral/antumbral shadow cones with respect to the axis of the lunar shadow

To get some idea of how this works I’ll reference the diagram above (again, credit to eclipsewise.com). The red rectangle represents the fundamental plane, a plane that passes through, and has its origin at, the center of the earth. This plane is always perpendicular to the line passing through the centers of the moon and the sun. This line is called the shadow axis, and intersects the fundamental plane at position (x,y). In this coordinate system, the shadow cast by the moon appears as a perfect circle on the fundamental plane, centered around the shadow axis, these are shown as the green circles in the above diagram. For a total solar eclipse we have two of these circles, one for the umbra (the area where a total eclipse is visible) and the penumbra (the area where only a partial eclipse is visible). Given these values, it is now fairly straight-forward to compute the position and size of the eclipse shadow at a given time, relative to the center of the earth.
However, at this point you might be thinking (as I did) - “that’s great, but how does this translate to a position on the Earth’s surface?“. Several sources I read described this as a trivial process of projecting the (x,y) position and shadow radius onto the surface of the earth. Since I have a very light background in mathematics, this certainly didn’t feel trivial, however it is essentially a solved problem, so I turned to two books that were kind enough to derive this projection for me: Explanatory Supplement to the Astronomical Almanac [1] and Elements of Solar Eclipses: 1951-2200 [2]. The projection calculation takes into account the earth’s rotation (which fluctuates over time and is corrected by a value called ΔT), the earth’s average equatorial radius (which varies with mountains and valleys), and the fact that earth is not a sphere but rather an oblate spheroid (think of a ball of putty that has been gently squished vertically). The calculated projection can then be used to transform between a point on the earth’s surface (latitude and longitude), and a point on the fundamental plane (x,y).
Drawing a Map
At last, I have all the tools I need to calculate the umbral and penumbral shadow outlines and plot these curves on a map. Since my intent was to draw these curves on a map in a web browser, such as Mapbox-gl, I needed to generate GeoJSON representations. For a curve depicting the outline of the umbral shadow, I would need to generate a GeoJSON polygon containing a list of latitude/longitude coordinates.
Starting from the Besselian elements (x,y) coordinate, I can extend a line out along the fundamental plane until it intersects the circle of the umbral/penumbral shadow. This intersection point can then be projected/transformed to a coordinate on the earth’s surface, giving us a (latitude,longitude) location that falls on the boundary of the shadow outline. To get a complete outline, we rotate the line extending out from (x,y) by some angle and again compute the intersection with the shadow circle. Repeating this for a series of angles from 0-360 degrees produces a polygon on the earth’s surface representing the boundary of the shadow.
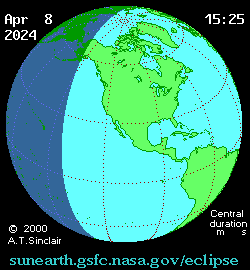
Note that these calculations are done for one particular instant in time. To show an animation these calculations must be repeated for each time step throughout the duration of the eclipse. Most eclipse animations I’ve encountered are offline rendered, meaning they precompute each time step and then play back as a video or animated gif (for example the animated gif below, credit NASA/Fred Espenak).
This approach is common since each time step can be precomuted once and played back as a video/gif, reducing the computing power requirements of the viewer. However, I wanted to be able to explore with greater interactivity, for example to slow or speed up the animation without sacrificing temporal resolution. Considering that a modern user has significantly more compute power at their disposal, compared to that of 20 years ago when these animiations were becoming common, I wanted to render these time steps in real-time, live in the user’s web browser. Given the incredible Javascript performance available in modern web browsers, along with GPU acceleration leveraged by Mapbox-gl, it seemed entirely plausible to provide a good, performant user experience.
Results
Well, check out the result for yourself. I’m quite happy with the smooth performance this achieves. The user can scrub backward/forward in time, zoom in to a desired location, all while still calculating shadow outlines and rendering live.
Certainly there are several areas I would like to improve upon, namely user experience. For example, despite implementing the ability to render shadow outlines at an arbitrary time value, the scrubbing bar available to the user is limited to the resolution of their screen. To improve this I could implement an adaptive scrub, where the user drags upwards, and subsequent dragging left/right will then scrub through time at a lower rate.
Some other nice-to-have’s would be those features found in other eclipse prediction/planning applications, such as the contact times - the time when the eclipse starts, reaches totality, and ends for a given location.
Although there are no other total solar eclipses coming through North America any time soon, I do intend to revist this application and hopefully provide tools to eclipse hunters out there that may find this useful. If you’ve made it this far, thanks for coming along with me, and I hope you learned something as I did through this experience.
Reference
- Urban, S. E., & Seidelmann, P. K. (2013). Explanatory Supplement to the Astronomical Almanac. University Science Books.
- Meeus, J. (1989). Elements of Solar Eclipses: 1951-2200. Willmann-Bell.